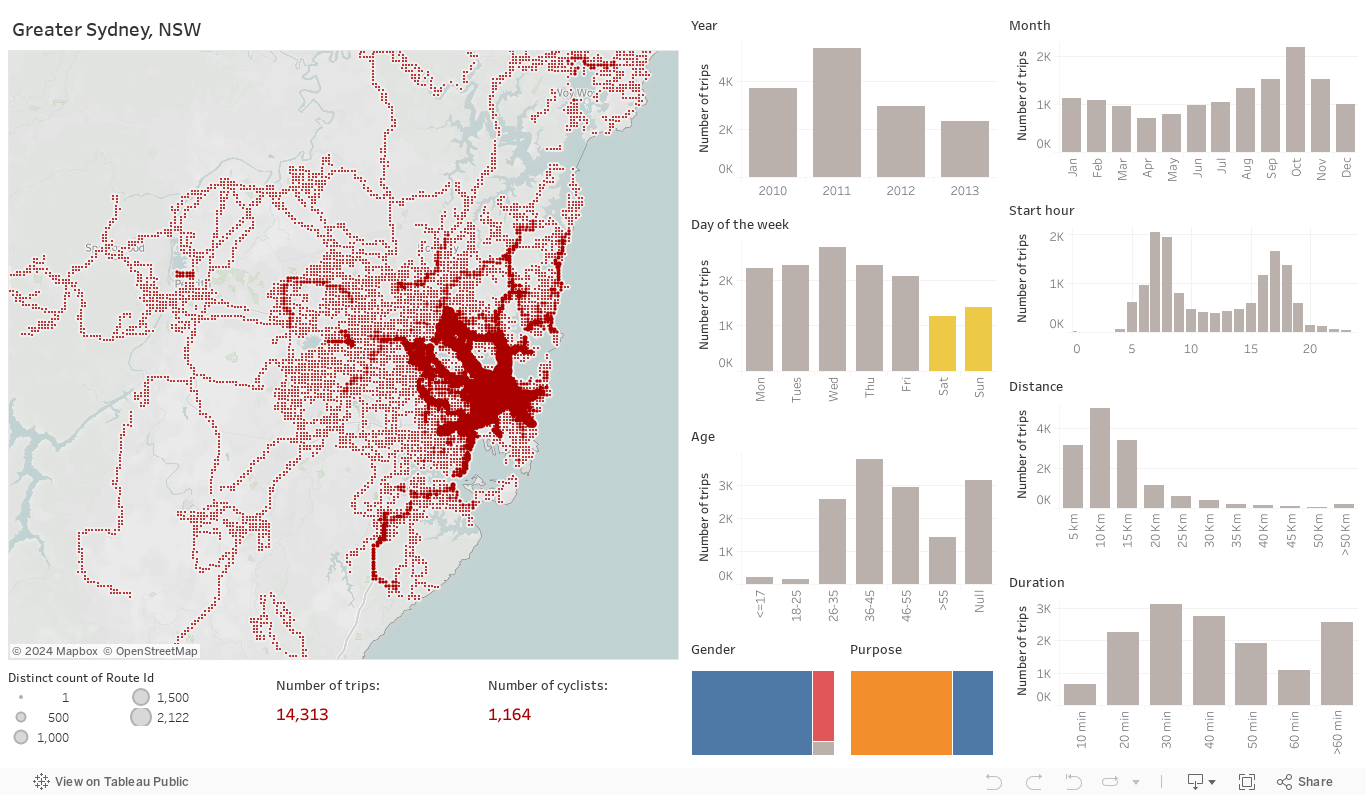
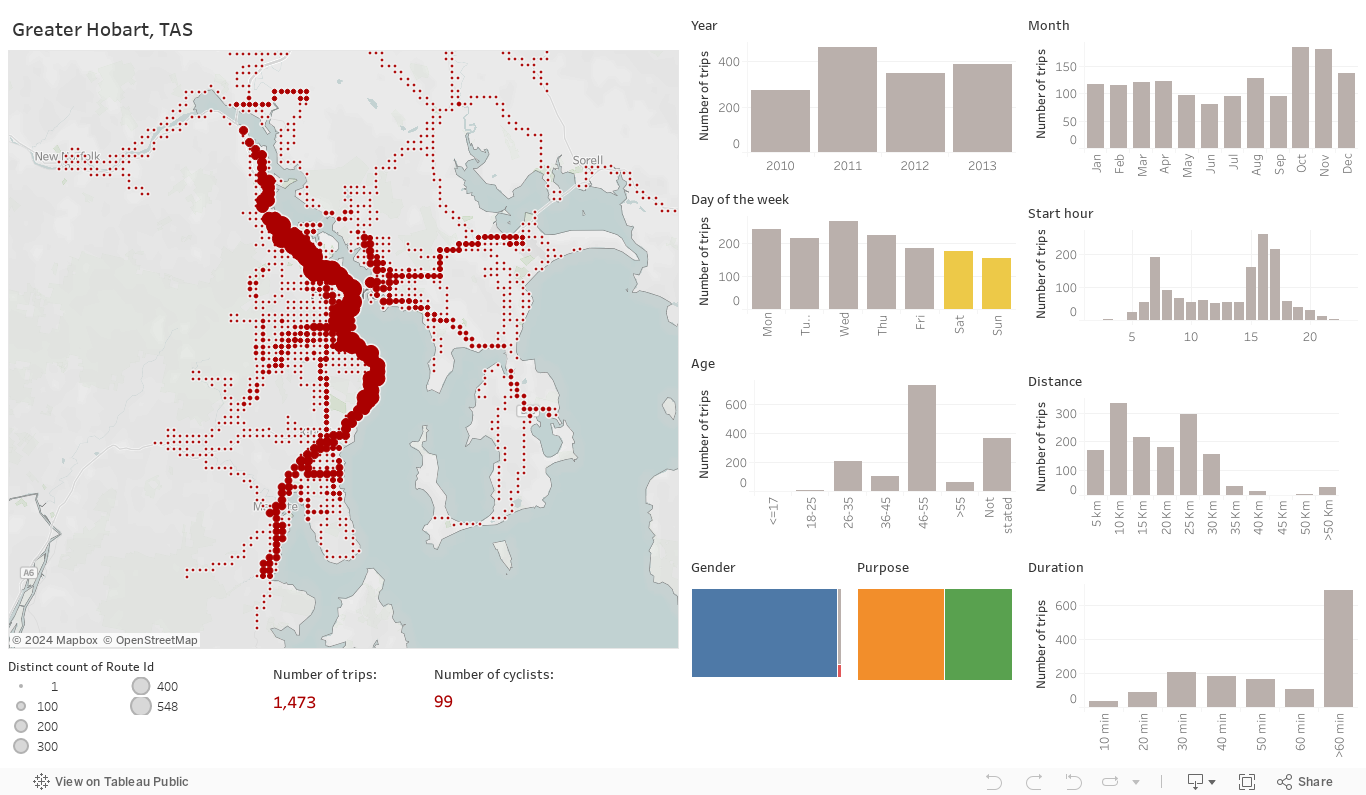
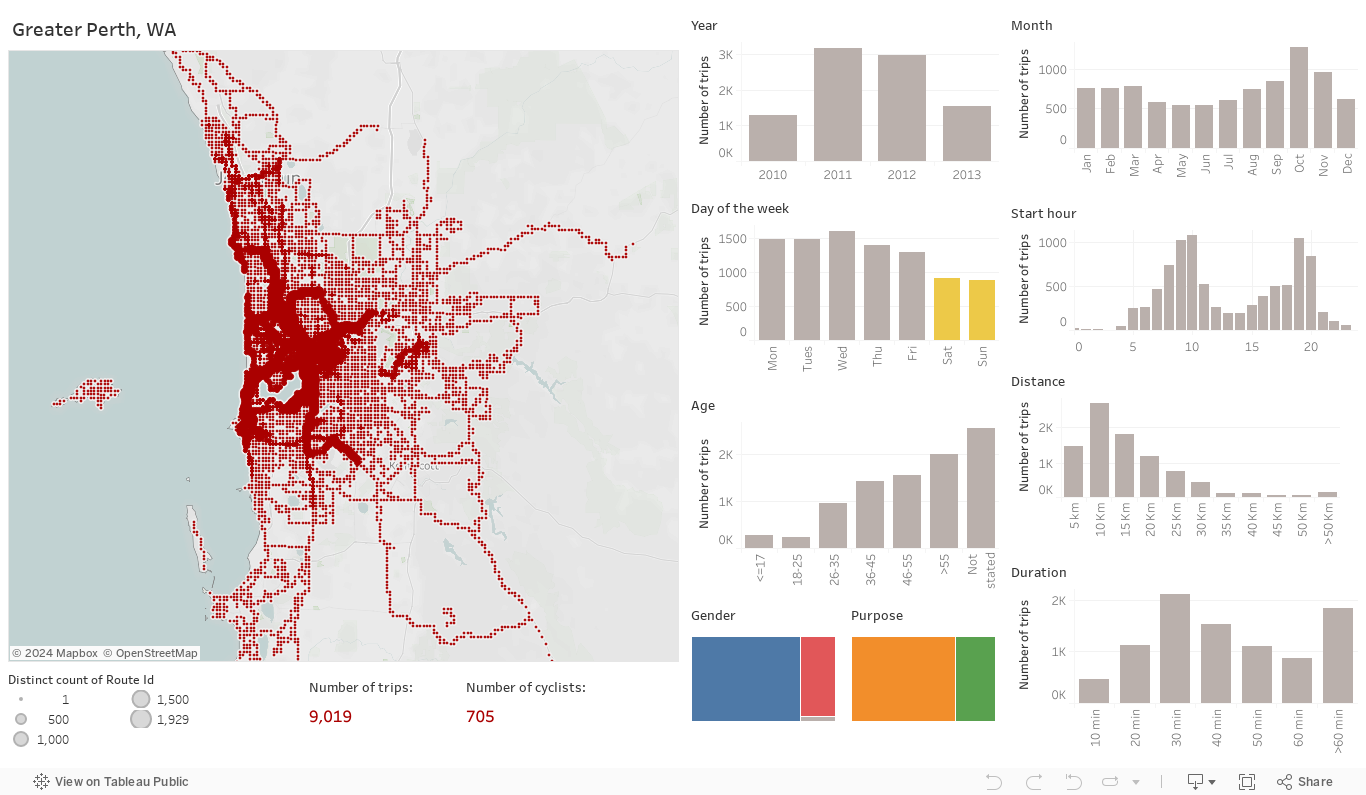
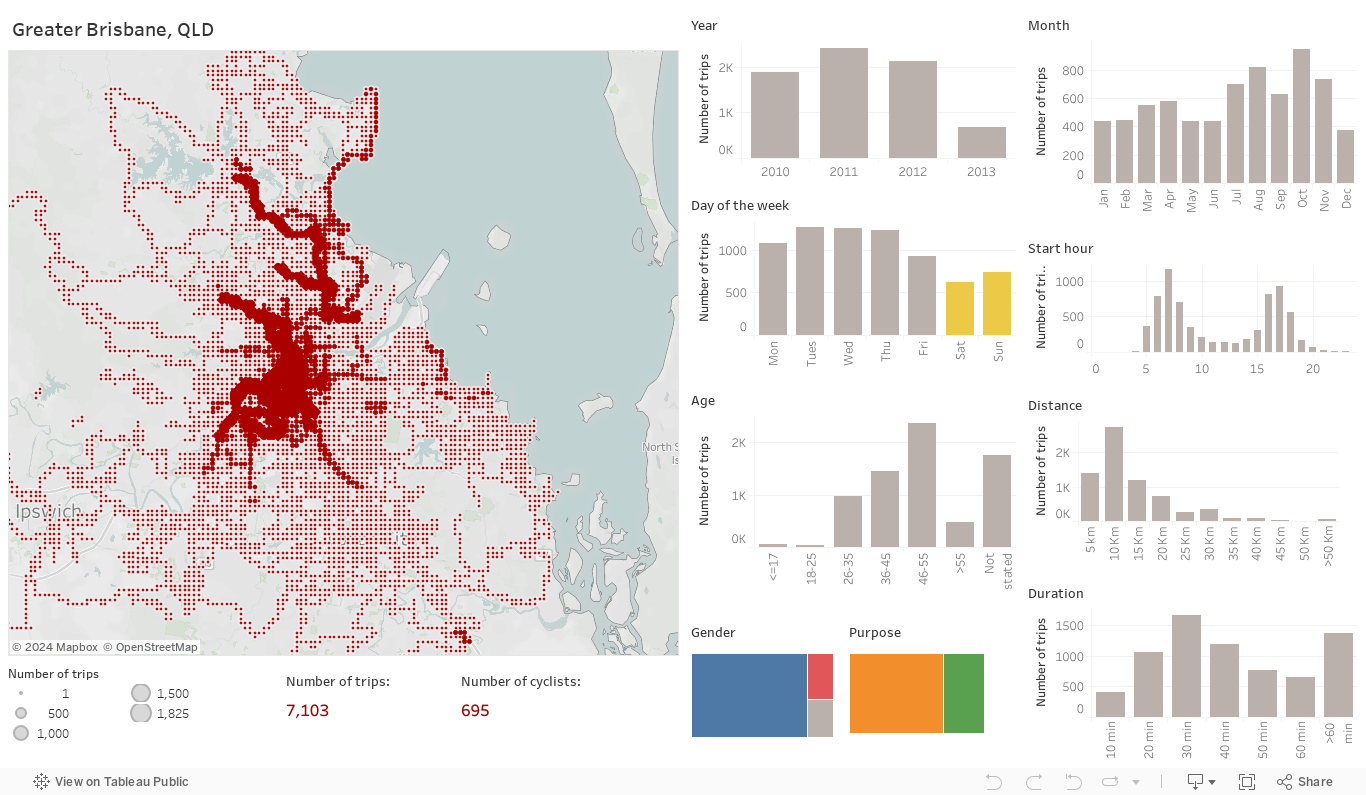
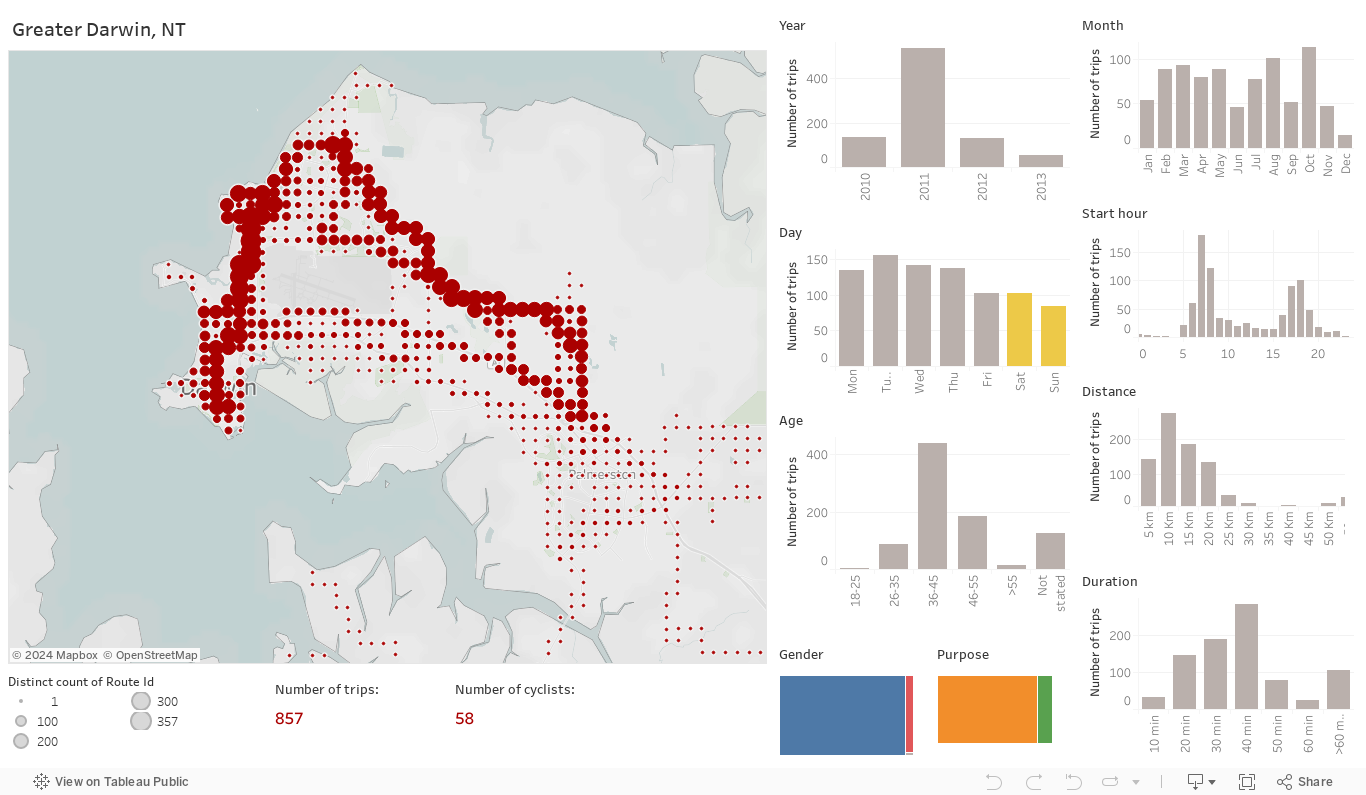
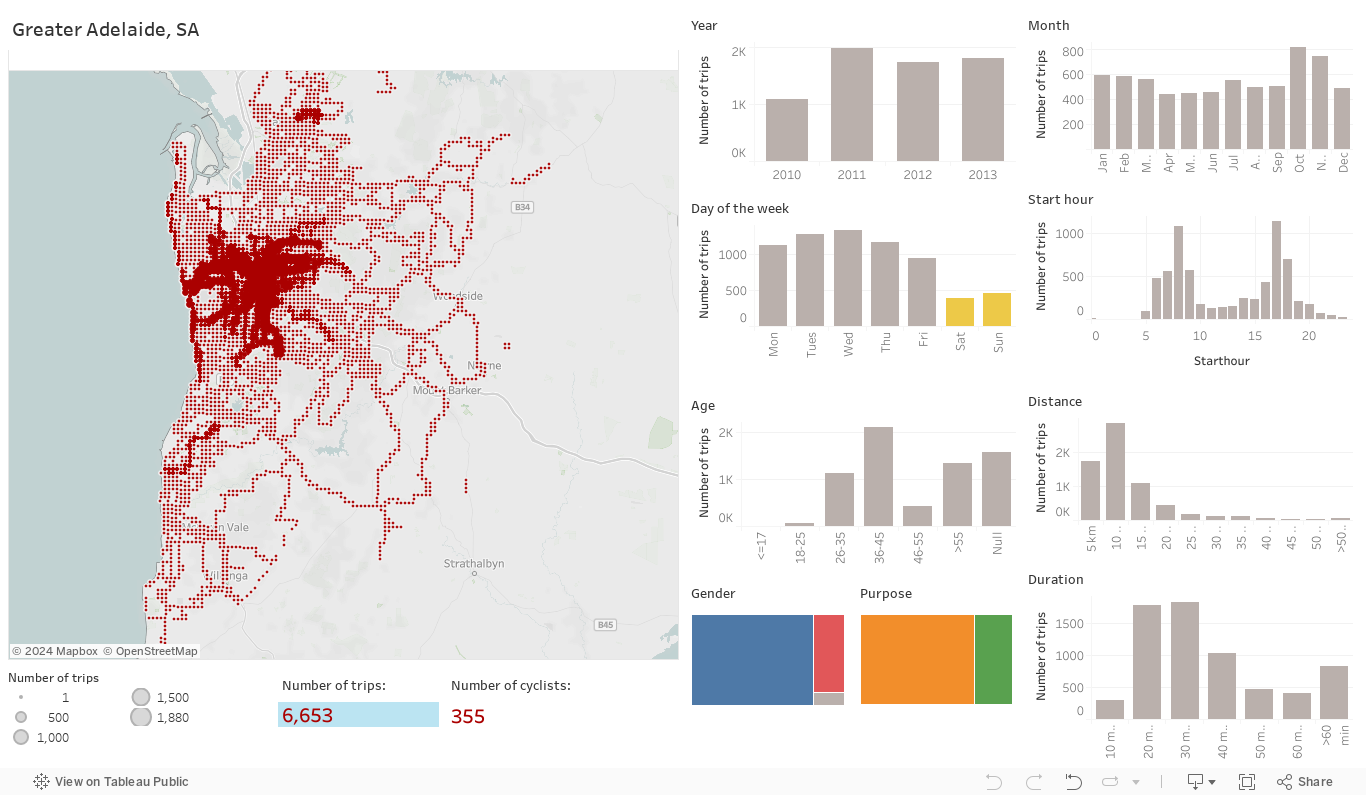
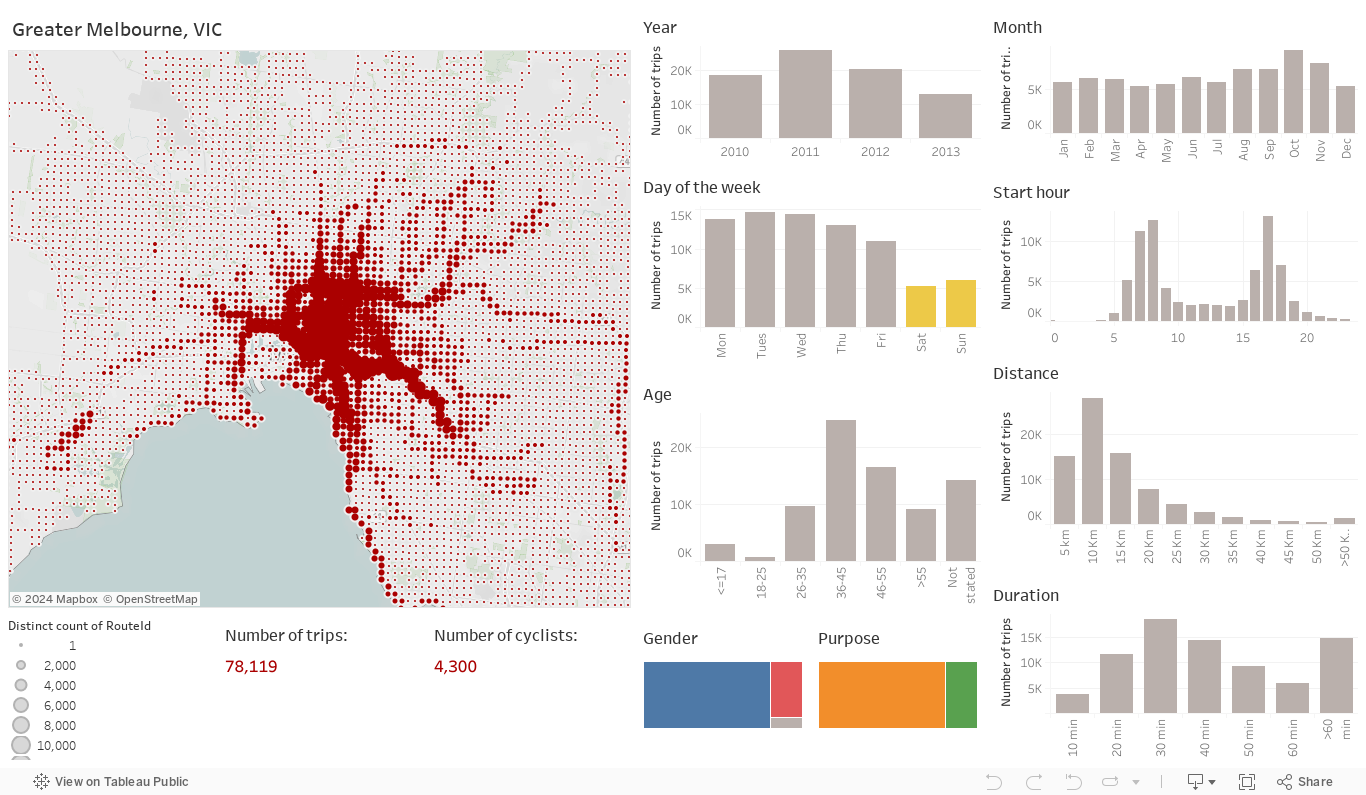
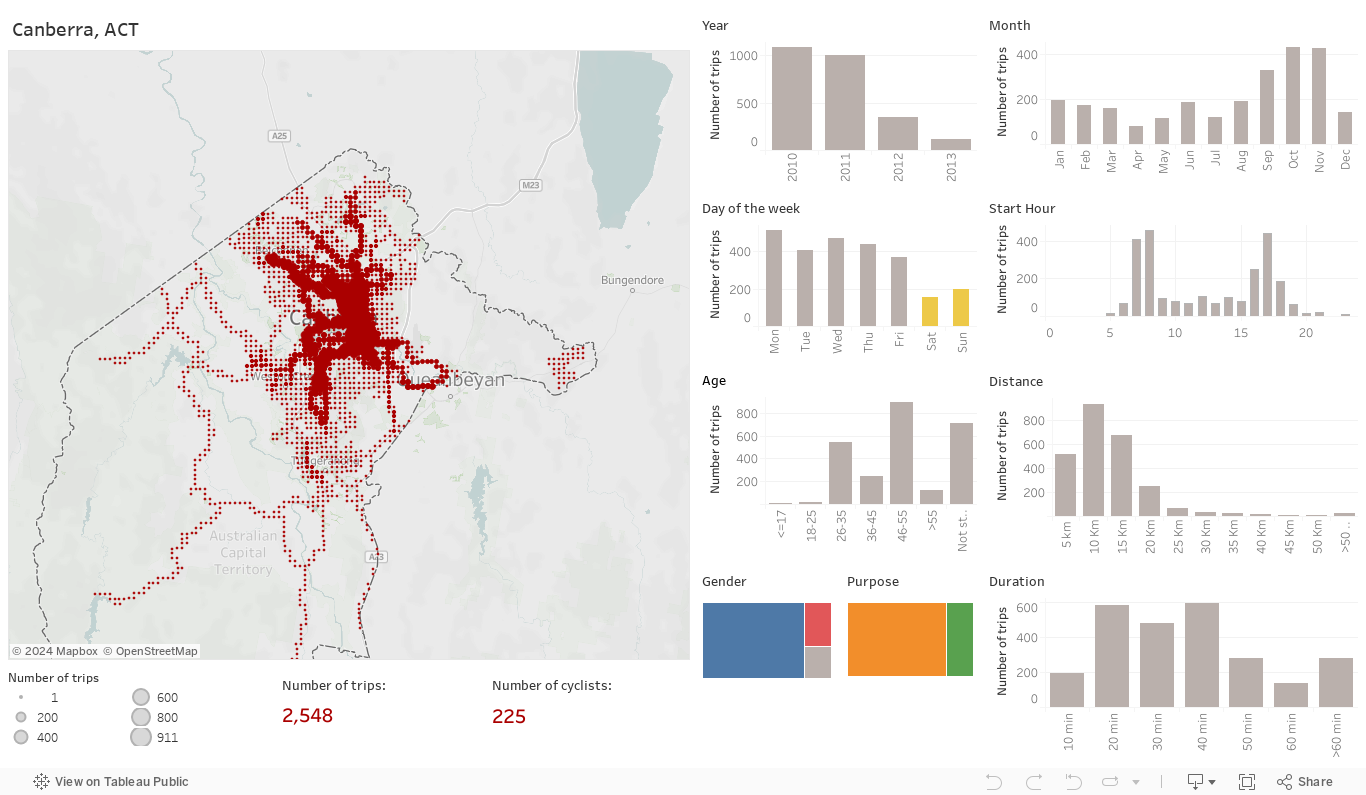
This visualisation provides interactive and synchronised maps and graphs, which allow online data analytics characterising bicycle trips in all Greater Capital Cities in Australia. Choose the city you want to visualise by clicking on the buttons above. Select one or more items on the graphs, and the maps and graphs will automatically update to that selection. One can, for example, explore where female riders with a certain age and purpose ride on specific days of the week and time of the day. The maps are based on 120,085 GPS tracked cycling journeys by 7,601 cyclists from RiderLog app from May 2010 through December 2013. The anonymised data behind the dashboards are open and free for non-commercial purposes (data doi: 10/b855); and can be downloaded from CityData at https://citydata.be.unsw.edu.au/.
Leao S.Z., Lieske S.N., Conrow L., Doig J., Mann V., Pettit C.J. Building a national-longitudinal geospatial bicycling data collection from crowdsourcing, Urban Science, 1 (3), 23. 2017
Pettit, C.J. Lieske, S.N. Leao, S.Z. Big Bicycle Data Processing: From Personal Data to Urban Applications, ISPRS XXIII Congress 2016, Prague, Czech Republic, July 12-19th 2016.
This data was acquired from Bicycle Network as collected through their RiderLog App.
Visualisation creators: Dr Simone Z Leao and Prof Chris Pettit.